| Type of paper: | Research paper |
| Categories: | Company Banking Financial analysis |
| Pages: | 7 |
| Wordcount: | 1757 words |
Comerica Incorporated is one of the successful financial services companies in the world and attracts a wide range of customers. It has its headquarters in Dallas, Texas and it has operational branches in Texas, Michigan, Florida, Arizona, and California. The company also has operations in Canada and Mexico. Most of its major operations are carried out in Philadelphia, Dallas, Auburn Hills, Michigan, Livonia, and Cincinnati. When it was founded in 1849 in Detroit by Elon Farnsworth, it was known as Detroit Savings Fund Institute. It later changed to Detroit Savings bank and later to Detroit Bank in 1871 and 1936 respectively. After merging with other banks like Birmingham Bank, Detroit Wabeek Bank, and Ferndale Bank, it changed its name to the current one. It has made several changes to its management and has merged and acquired more companies. It's currently among the most successful bank s and has the potential to grow further in the near future (Allayannis, Ramraika, Allayannis, & Ramraika, 2017). The analysis of the company's financial analysis and comparing it with the rest of the competitors in the industry shows the differences in performance among them.

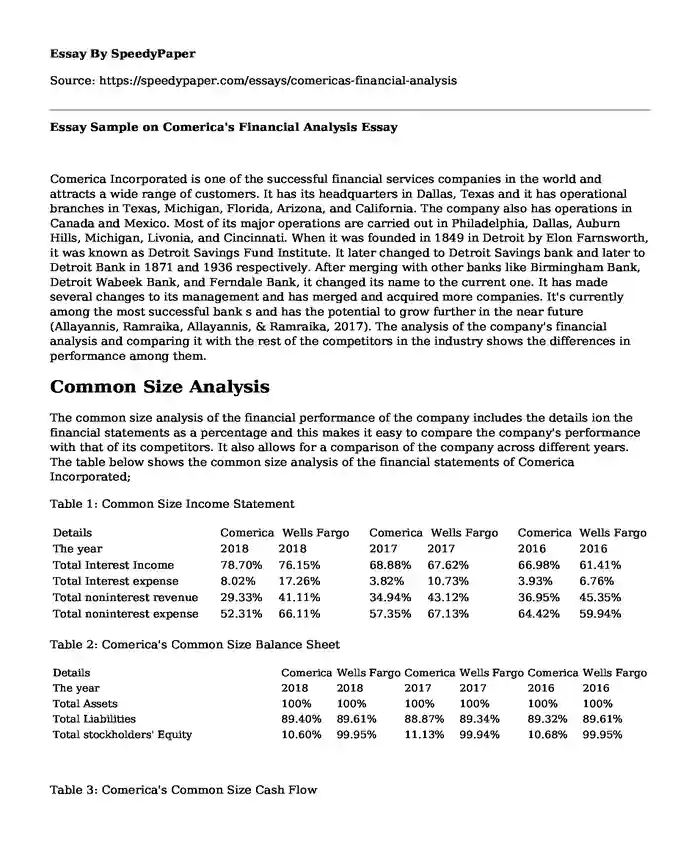
Common Size Analysis
The common size analysis of the financial performance of the company includes the details ion the financial statements as a percentage and this makes it easy to compare the company's performance with that of its competitors. It also allows for a comparison of the company across different years. The table below shows the common size analysis of the financial statements of Comerica Incorporated;
Table 1: Common Size Income Statement
| Details | Comerica | Wells Fargo | Comerica | Wells Fargo | Comerica | Wells Fargo |
| The year | 2018 | 2018 | 2017 | 2017 | 2016 | 2016 |
| Total Interest Income | 78.70% | 76.15% | 68.88% | 67.62% | 66.98% | 61.41% |
| Total Interest expense | 8.02% | 17.26% | 3.82% | 10.73% | 3.93% | 6.76% |
| Total noninterest revenue | 29.33% | 41.11% | 34.94% | 43.12% | 36.95% | 45.35% |
| Total noninterest expense | 52.31% | 66.11% | 57.35% | 67.13% | 64.42% | 59.94% |
Table 2: Comerica's Common Size Balance Sheet
| Details | Comerica | Wells Fargo | Comerica | Wells Fargo | Comerica | Wells Fargo |
| The year | 2018 | 2018 | 2017 | 2017 | 2016 | 2016 |
| Total Assets | 100% | 100% | 100% | 100% | 100% | 100% |
| Total Liabilities | 89.40% | 89.61% | 88.87% | 89.34% | 89.32% | 89.61% |
| Total stockholders' Equity | 10.60% | 99.95% | 11.13% | 99.94% | 10.68% | 99.95% |
Table 3: Comerica's Common Size Cash Flow
| Details | Comerica | Wells Fargo | Comerica | Wells Fargo | Comerica | Wells Fargo |
| The year | 2018 | 2018 | 2017 | 2017 | 2016 | 2016 |
| Net cash from operating activities | 1,616 | 36,073 | 1,103 | 18,722 | 493 | 169 |
| Net cash from investment activities | 1,156 | 7,754 | 138 | 5,164 | 270 | 122,119 |
| Net cash for/from financing activities | 1,744 | 79,979 | 2,338 | 10,920 | 848 | 123,568 |
The above analysis shows the key items contained in the three most important financial statements that investors consider in their analysis of a company. The stability of the company is determined by the way the available finances are used and how the company can meet its financial obligations. The figures show that the company is financially stable and the trend shows it will have a good performance in the future. The financial details shown in the common size analysis prove that the company is competitive as compared to the rest of the companies in the industry.
Trend Analysis
The analysis of the financial statements of the company for the past 5 years shows that the company has performed considerably well. The table below shows some of the details of the performance trend of the company.
The growth rate of the company shows that the company improved between 2014 and 2015, then reduced in 2016 and more in 2017. There was some slight improvement in 2018. The trend is a confirmation that the company's management could have made different decisions and that the outcomes of those decisions affected the performance of the company. Some of the details included in the analysis above shows that the company operates in a competitive and dynamic industry where factors like political decisions can lead to sudden changes in the company's performance. Political decisions made by the federal or state governments have major impacts on business (Brink, 2017; Lin, Chang, Yu, & Kao, 2019). It is valid to conclude that the financial performance of the company could have been affected partly by the political decisions made during those periods.
The most important information from this analysis is that the company has good management that makes the right decisions and on time. The revenue and net income are some of the key considerations made by investors. The two are an indication of the financial health of the business. The analysis above shows that the company has the potential to increase its wealth in the future and increase the wealth of the investors.
Financial Ratio Analysis
Financial ratios are a summarized view of the financial performance of a company. Some of these ratios include liquidity ratios, operating performance ratios, return on investment ratios and profitability ratios.
Table 4: Financial Ratios
| 2018 | 2017 | 2016 | |
| Current ratio | 1.02 | 1.0 | 0.96 |
| Quick ratio | 1.02 | 1.2 | 0.98 |
| PE ratio | 9.0 | 9.5 | 8.5 |
| Profit margin ratio | 34.75% | 33.12% | 32.12% |
The analysis shows that the company has a strong financial performance and it has high profits. A current ratio is a liquidity ratio and it shows the ability of the business to pay its short term obligations that are due in one year. It is measured by dividing the current assets by the current liabilities. It is a show of the possibility that the company will clear its short term liabilities using the current assets it has. For Comerica Incorporated, the ratio is positive and it means that the company can clear its short term obligations easily. The ratios improved between the years 2016 and 2018. The improvements give a positive indication that the company is likely to perform better in the future. A company that has positive current ratios attracts more investors than the one with a low or negative one. In view of the management, the ratio is a good indication of healthy performance.
The quick ratio is an indication of the short term liquidity of the company. It shows the ability of the company to meet its short term obligations using its most liquid assets. It is also known as the acid test ratio and it is calculated by adding the cash to cash equivalents and accounts receivable value and the total is divided by the total of the current liabilities. For the Comerica Incorporated, the quick ratio increased from 0.98 to 1.2 and later to 1.02 between 2016 and 2018. The ratios also indicate that the company is making good profits using the assets available. The ratios show that there are chances that of the assets are increased, the company will make higher profits in the future. For example, with a quick ratio greater than 1.0, the company is in a position to clear its debts with the current assets. Investors could use this ratio to increase the trust that people have on the company. However, there are many other factors that investors could consider, including the trend in the industry.
The price-to-earnings ratio (PE ratio) is a measure of the current share price relative to its earnings per share (EOS) earnings. A higher ratio is an indication that the investors are willing to buy the shares at a higher price today because they have hopes that the company will have a better performance in the future. In other words, the higher the ratio, the more the investors are willing to pay for the $1 of the current earnings (Wang, Chatpatanasiri, & Sattayatham, 2017). The analysis above shows that increased by 10 points between 2016 and 2017 and then reduced by 5 points in 2018. The ratio is high but the trend is worrying. From the management's point of view, it is necessary to put in measures that can stabilize the ratio or improve it. The profit margin ratio shows the amount of profit earned from each dollar of sales. In the above analysis, this ratio improved over the three years and this is a positive sign. Some of the ways that the company can improve the ratios above include an improved promotion, differentiation, lobbying, and marketing.
Return on Equity
The return on equity (RoE) is a useful measure of the effectiveness of the management in making profits using the assets of the company. The analysis of the common ratios related to RoE helps understand the company's performance.
The analysis of the ratios above suggests that the company operates in a highly dynamic industry and this requires a consistent change in management decisions and targets to meet the needs of the consumers. The RoE increased steadily in the three years and this a sign of good performance. The same ratio fluctuated for Wells Fargo, one of the main competitors. The fluctuation is an indication that the companies are affected differently by the factors in the market. One of the main factors that can affect the RoE of a company is its debt level. If the company has many debts, the RoE will slow down and vice versa. The asset turnover ratio of the two companies remained relatively steady, an indication that the two companies had similar ways in which they use the available assets to make money. The financial leverage of the company fluctuated over the three years and this means that there is no specific or steady factor that affects the company. The diversity of factors leads to fluctuation. If the management in Comerica wanted to improve the ratios, there are several strategies that include a reduction of the debt level, an improvement of the marketing processes and better management of the assets.
Recommendation
The analysis above shows that the company has a good performance trend and that it can improve its performance by improving its management strategies. The strategies used to handle management challenges should be focused on the profitability of the company and its strategic goals (Gandy, 2015). The company's management requires a change in the strategies that affect the ratios negatively. For example, if the assets are overvalued, the company should make the necessary adjustments and if the total assets of the company tend to shrink, then the management should get ways of restoring it. The asset turnover ratio should also be improved over the years to increase the attraction of the company to the investors. Any idle cash should be distributed to the company's operations and used to increase the profitability recorded year after year.
The trend observed in some of the ratios suggests that there are challenges with value creation and making profits from the company's operations. The management should introduce strategies that can motivate the employees to be more innovative and willing to take part in the changes in the company. Some of the challenges that could lead to poor performance are the usage of cash. If the company has idle cash, then it is advisable to distribute the cash to more profitable activities that could generate income for the business. The company's cash and cash equivalents should be maintained at a level that is just enough to cater for the short-term obligations. The rest of it should be invested. The management should also consider differentiation and price strategies to outdo the competitors in earning a larger market share and maintaining their consumers.
Cite this page
Essay Sample on Comerica's Financial Analysis. (2023, Jan 17). Retrieved from https://speedypaper.com/essays/comericas-financial-analysis
Request Removal
If you are the original author of this essay and no longer wish to have it published on the SpeedyPaper website, please click below to request its removal:
Popular categories


