| Type of paper: | Essay |
| Categories: | Data analysis Statistics Software |
| Pages: | 6 |
| Wordcount: | 1606 words |
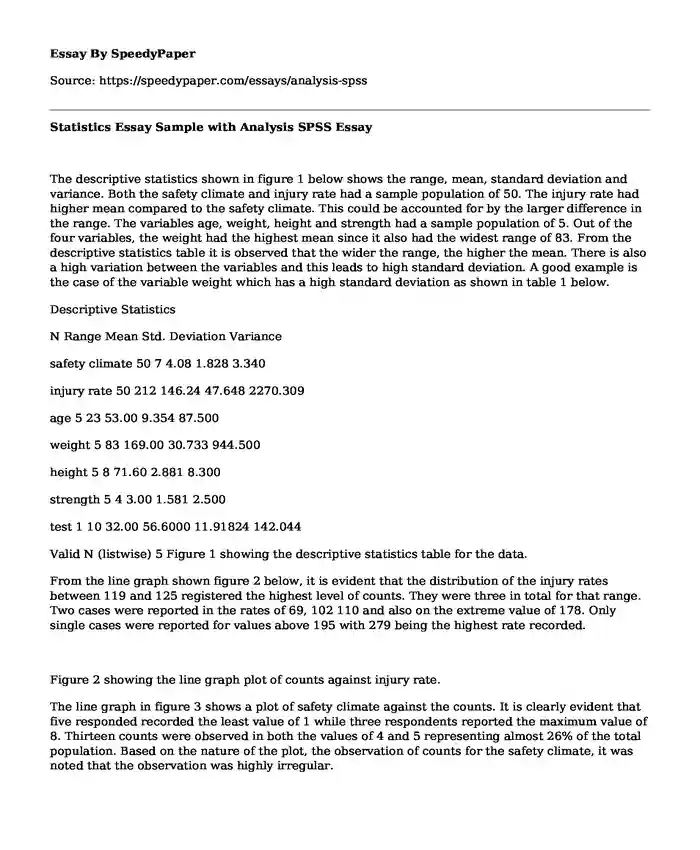
The descriptive statistics shown in figure 1 below shows the range, mean, standard deviation and variance. Both the safety climate and injury rate had a sample population of 50. The injury rate had higher mean compared to the safety climate. This could be accounted for by the larger difference in the range. The variables age, weight, height and strength had a sample population of 5. Out of the four variables, the weight had the highest mean since it also had the widest range of 83. From the descriptive statistics table it is observed that the wider the range, the higher the mean. There is also a high variation between the variables and this leads to high standard deviation. A good example is the case of the variable weight which has a high standard deviation as shown in table 1 below.

Descriptive Statistics
N Range Mean Std. Deviation Variance
safety climate 50 7 4.08 1.828 3.340
injury rate 50 212 146.24 47.648 2270.309
age 5 23 53.00 9.354 87.500
weight 5 83 169.00 30.733 944.500
height 5 8 71.60 2.881 8.300
strength 5 4 3.00 1.581 2.500
test 1 10 32.00 56.6000 11.91824 142.044
Valid N (listwise) 5 Figure 1 showing the descriptive statistics table for the data.
From the line graph shown figure 2 below, it is evident that the distribution of the injury rates between 119 and 125 registered the highest level of counts. They were three in total for that range. Two cases were reported in the rates of 69, 102 110 and also on the extreme value of 178. Only single cases were reported for values above 195 with 279 being the highest rate recorded.
Figure 2 showing the line graph plot of counts against injury rate.
The line graph in figure 3 shows a plot of safety climate against the counts. It is clearly evident that five responded recorded the least value of 1 while three respondents reported the maximum value of 8. Thirteen counts were observed in both the values of 4 and 5 representing almost 26% of the total population. Based on the nature of the plot, the observation of counts for the safety climate, it was noted that the observation was highly irregular.
Figure 3 showing combined line graph plot of counts against safety climate and injury rate
In the case of figure 3 shown above, it was noted that no count was recorded for values less than one. This indicates that 1 was the least value for both the safety climate and the injury rate. The combined line graph also showed that the widest inter-range for the injury rate was observed between the values between 144 and 171. This serves to explain the shape of the graph.
Figure 4 showing combined line graph of counts against the safety climate and injury rate
Based on the analysis of the data, the table of co-efficient model shown below in figure 5, it is evident that a model of fit is obtained which can be used to calculate the outcome. The regression model equation of Y=178.544-7.918X indicates y as the injury rate and x as the safety climate. This model explains that the safety climate is not a good predictor of the injury rate because as the unit increases in safety, there is a corresponding decrease of 7.918 units in the injury rate. The Beta value of -3.04 clearly serves to show that safety climate is a weak predictor variable of the outcome.
The ANOVA table in figure 6 serves to support the fact that the results obtained is not significant as can be seen that the significant value of 0.032 which is less than the alpha value of 0.05. Upon investigating the F-value from the same ANOVA table, it is evident that the calculated F-value of 4.877 is much greater than the alpha value of 0.05. This validates the rejection of the null hypothesis which in this case is as follows:
Ho: There is no significant difference between the variance of safety climate and the injury rate.
H1: There is a significance difference between the variance of safety climate and injury rate
The F-value being greater than the alpha is thus an indication that the alternative hypothesis should be accepted. It is thus acceptable to conclude statistically that there is significance difference between the two variables as seen in the F-value from figure 6.
CoefficientsaModel Unstandardized Coefficients Standardized Coefficients t Sig.
B Std. Error Beta 1 (Constant) 178.544 16.001 11.158 .000
safety climate -7.918 3.585 -.304 -2.208 .032
a. Dependent Variable: injury rate
Figure 5 showing a co-efficient table
ANOVAaModel Sum of Squares dfMean Square F Sig.
1 Regression 10260.950 1 10260.950 4.877 .032b
Residual 100984.170 48 2103.837 Total 111245.120 49 a. Dependent Variable: injury rate
b. Predictors: (Constant), safety climate
Figure 6 showing the ANOVA table for the data
Figure 7 showing the model summary table
From the model summary table in figure 7, the adjusted R square is 0.73. Multiplying this value by 100 then it means that the safety climate could only explain 7.3% variance of the injury rate. Again this is a very weak correlation between the predictor variable and the outcome.
In the case of figure 8 below, the normal distribution graph shows the Regression standardization residual of the injury rate. As can be seen from the graph, most values are within the bell-shaped curve thus an indication that the data range for the injury rate was normally distributed. This validates the results of the regression. At 95% confidence level, the results drawn from the analysis are verified due to the aspect of normality which is one of the most crucial assumptions made when carrying out regression analysis.
Figure 8 showing the normal distribution graph for regression standardized residual
Analyzing the social class of the respondents social class, it is evident that 60% of the respondent came from the lower class as compared to 30% who hailed from medium class. The upper social class was only a representative of 10% of the total population. Figure 9 shows the data displayed in a pie chart.
Figure 9 showing a pie chart displaying the percentage of the respondents social class
The other pie chart shows the distribution of the experiences of the respondents. It was noted that majority of the respondents in the study had a high level of experience which in the study is defined as having an experience level of 11 years and above. 30% of the total respondents had a medium experience which in the study is defined as 6-10 years. The medium experience level distribution in the pie chart is equal in proportion to that of the respondent who had a low level of experience ranging from 0-5 years. This was 30% of the total distribution as shown in figure 10 below.
Figure 10 showing a pie chart that displays the percentage of the respondents level of experience
A histogram plot showing the distribution of injury rate of the respondents clustered by their level of experience in figure 11 demonstrated that those who had a low level of experience were evenly distributed across the injury rate values. Six cases were reported to have values between 150-200 and only two extreme cases observed for those who exceeded 200. The extremes could be attributed to the fact that those with low level of experience had the fear of making mistakes and hence tried ways of adapting to the new environment. It is also noted that out of the 15 respondents with low experience only seven cases were reported to have values below 150 as shown in the histogram.
For the respondents with experience medium level of experience, 8 out of the 15 respondents exceeded the value of 150 with the extreme values ranging between 250 and 300. The scattered distribution in the medium level could be explained by the fact that the respondents were also trying new methods with little experience hence the observation.
For those with high level of experience ranging from 11 years and above, all the twenty respondents showed no case of values exceeding 200. It is however noted that majority fell within the bracket of 100-200. The observation as seen in the histogram can best be explained by the fact that armed with a high level of experience, the respondents had perfectly adapted to the new environment. This eliminated the fear to explore new ideas as they had perfected their art in supervision.
Figure 11 showing histogram showing distribution of injury rate of the respondents clustered by their level of experience
Analysis of the distribution of safety climate and the experience of the respondent was quite different from that of the injury rate. For those who had a low level of experience, majority of the cases had a safety climate value of 4-6. Only two cases had an extreme value of 8. The respondents with a low medium level of experience had majority of the cases falling under the range of 2-4 safety climate value. In this category, no extreme cases were noted exceeding the value of 6. It was also noted that out of twenty of those who had a high level of experience, only a single case was found to have exceeded a safety climate value of 6 as show in figure 12 below:
Figure 12 showing histogram showing distribution of safety climate of the respondents clustered by their level of experience
References
Green, S. B., & Salkind, N. J. (2014). Using SPSS for Windows and Macintosh: Analyzing and understanding data (7th ed.). Upper Saddle River, NJ: Pearson
Laureate Education (Producer). (2009). Frequency distributions [Video file]. Retrieved from https://class.waldenu.edu
Laureate Education (Producer). (2009). Central tendency and variability [Video file]. Retrieved from https://class.waldenu.edu
Ongori, H., & Agolla, J. E. (2008). Occupational stress in organizations and its effects on organizational performance. Journal of Management Research, 8(3), 123135.
Retrieved from the Walden Library database
Pearson Education. (2010). Datasets to accompany Using SPSS for Windows and Macintosh by Green and Salkind [Data file]. Retrieved from http://media.pearsoncmg.com/ab/salkind/new_datasets_7e.zip
Puryear, A. N., Rogoff, E. G., Lee, M.-S., Heck, R. K. Z., Grossman, E. B., Haynes, G. W., & Onochie, J. (2008). Sampling minority business owners and their families: The understudied entrepreneurial experience. Journal of Small Business Management, 46(3), 4224 55.Retrieved from the Walden Library database
Cite this page
Statistics Essay Sample with Analysis SPSS. (2019, Oct 28). Retrieved from https://speedypaper.com/essays/analysis-spss
Request Removal
If you are the original author of this essay and no longer wish to have it published on the SpeedyPaper website, please click below to request its removal:
- Free Essay on Change Management and Leadership
- Why Physics - Essay Sample
- Free Essay Example on Social Vulnerability
- Essay Sample for Students: Gender Discrimination at the Workplace
- Essay Sample on Economics: Russia and Saudi Arabia
- How Michael Jackson Transformed the American Music Industry and Culture - Research Paper
- Essay Sample: The Coronavirus Impacts on International Business
Popular categories


