| Type of paper: | Essay |
| Categories: | Analysis Statistics |
| Pages: | 2 |
| Wordcount: | 310 words |
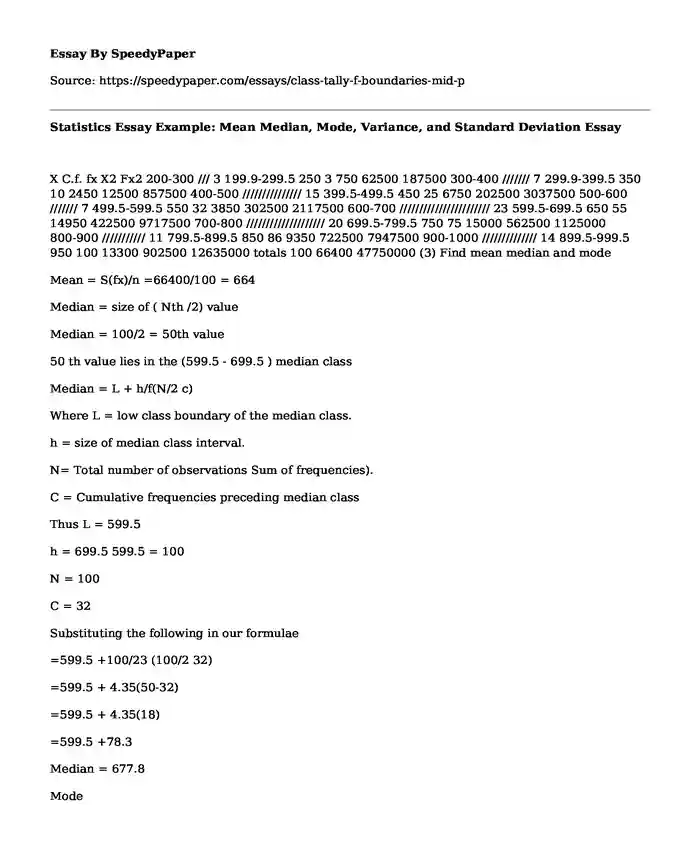
X C.f. fx X2 Fx2 200-300 /// 3 199.9-299.5 250 3 750 62500 187500 300-400 /////// 7 299.9-399.5 350 10 2450 12500 857500 400-500 /////////////// 15 399.5-499.5 450 25 6750 202500 3037500 500-600 /////// 7 499.5-599.5 550 32 3850 302500 2117500 600-700 /////////////////////// 23 599.5-699.5 650 55 14950 422500 9717500 700-800 //////////////////// 20 699.5-799.5 750 75 15000 562500 1125000 800-900 /////////// 11 799.5-899.5 850 86 9350 722500 7947500 900-1000 ////////////// 14 899.5-999.5 950 100 13300 902500 12635000 totals 100 66400 47750000 (3) Find mean median and mode

Mean = S(fx)/n =66400/100 = 664
Median = size of ( Nth /2) value
Median = 100/2 = 50th value
50 th value lies in the (599.5 - 699.5 ) median class
Median = L + h/f(N/2 c)
Where L = low class boundary of the median class.
h = size of median class interval.
N= Total number of observations Sum of frequencies).
C = Cumulative frequencies preceding median class
Thus L = 599.5
h = 699.5 599.5 = 100
N = 100
C = 32
Substituting the following in our formulae
=599.5 +100/23 (100/2 32)
=599.5 + 4.35(50-32)
=599.5 + 4.35(18)
=599.5 +78.3
Median = 677.8
Mode
Mode = L + (fm fm-1)/ {(fm fm-1) + (fm fm+1)}
L = low class boundary of the modal class.
Fm-1 = in the frequency of the group before the modal group
Fm = is the frequency of the modal group
Fm+1 = is the frequency of the group after modal class.
W =is the group with
L =599.5
fm-1 = 7
f m = 23
f m+1 =20
w = width of the modal class
substituting this in our formula we have
mode = 599.5 +{ (23-7) x}/ {(23 -7) (23 -20)}
mode = 599.9 + {(16/19) x 100 }
mode= 684.11
(4). Finding variance and standard deviation
Variance = S(X2/n) x2
Sx2 according top our frequency table = 47750000
N = 100
Mean = 664
Thus mean squared = 6642
= 440896
Substituting the following in the variance formulae
= {(47750000/100) 440896)
= 477500 440896
d2 = 36604
Standard deviation = variance
Standard deviation =36604
Standard deviation = 191.32
(5) .Compare mean, median, and state which you prefer as measure of location :From our data, our graph will portrays negative skew; the mean has the tendency of being pulled on the left side, which shows that the distribution is not symmetrical. Thus, median would be preferred as the measure of location of this data.
(6) .DRAW BAR GRAPH USING THE ABOVE:
(7). Find z value for smallest and largest data:
Z = (x-u)/d
X u ( X-u)
250 664 -414
350 664 -314
450 664 -214
550 664 -114
650 664 -14
750 664 86
850 664 186
950 664 286
Replacing the values in our formulae
Standard deviation = 191.32 as calculated earlier
Z = - 414/191.32
Z = -2.19
Z = 286/191.32 = 1.49
2.16 < z < 1.49
Cite this page
Statistics Essay Example: Mean Median, Mode, Variance, and Standard Deviation. (2019, Dec 09). Retrieved from https://speedypaper.com/essays/class-tally-f-boundaries-mid-p
Request Removal
If you are the original author of this essay and no longer wish to have it published on the SpeedyPaper website, please click below to request its removal:
- Good Writing in English as an International Language - Free Essay
- United States Office of Personnel Management
- Essay Example on Being a Responsible Person and Leader
- Essay Example: Analysis of the Country and the Political History
- Literature Review on Global Leadership
- Paper Example. Consumer Buying Influences and Behavior
- Paper Example on Political Film Project
Popular categories


